Examining Methane Emissions at Mumbai Waste Sites
Published on: Jul 22, 2026
Data Dispatch Series
Data Dispatches highlight insights and information from the Carbon Mapper data portal. Advancing global efforts to mitigate methane requires transparency, and Carbon Mapper is committed to delivering accessible methane and CO2 data that can be used by policymakers, regulators, operators, and civil society to guide science-based actions to reduce emissions.
What we see: Persistent methane emissions from landfills near Mumbai
A single Tanager-1 observation — also referred to as a ‘scene’ — can survey an entire metropolitan region, detecting methane emissions from multiple waste sites at once. In these two observations over the Mumbai region, methane plumes were detected at seven landfills or dumpsites in February 2025 and six sites in April 2026, totalling nine unique landfills and dumpsites with emissions visible from space.
Comparing the two observations shows that seven sites were observed on both days, with a majority of the sites showing persistent emissions across both observations despite being collected nearly a year apart.
Nine methane plumes from seven landfills and dumpsites across the Mumbai region were observed in a single Tanager-1 scene on February 9, 2025. Total waste sector emissions from point sources for the Mumbai region in this observation were approximately 4,100 kg CH4/hr. View this scene on our data portal (to recreate this image, use the layers tab to turn on ‘Coverage’ visibility, and turn off ‘Clusters’ visibility).
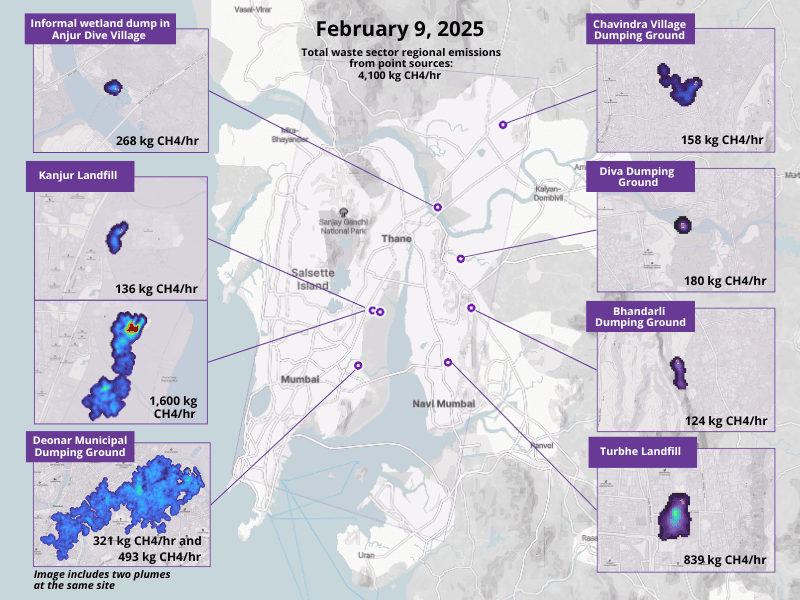
Nine methane plumes from seven landfills and dumpsites across the Mumbai region were observed in a single Tanager-1 scene on February 9, 2025.
Seven methane plumes from six landfills and dumpsites were observed in a single Tanager-1 scene across the Mumbai region over one year later on April 3, 2026. Total waste sector emissions from point sources for the area in this observation were approximately 5,000 kg CH4/hr. View this scene on our data portal (to recreate this image, use the layers tab to turn on ‘Coverage’ visibility, and turn off ‘Clusters’ visibility).
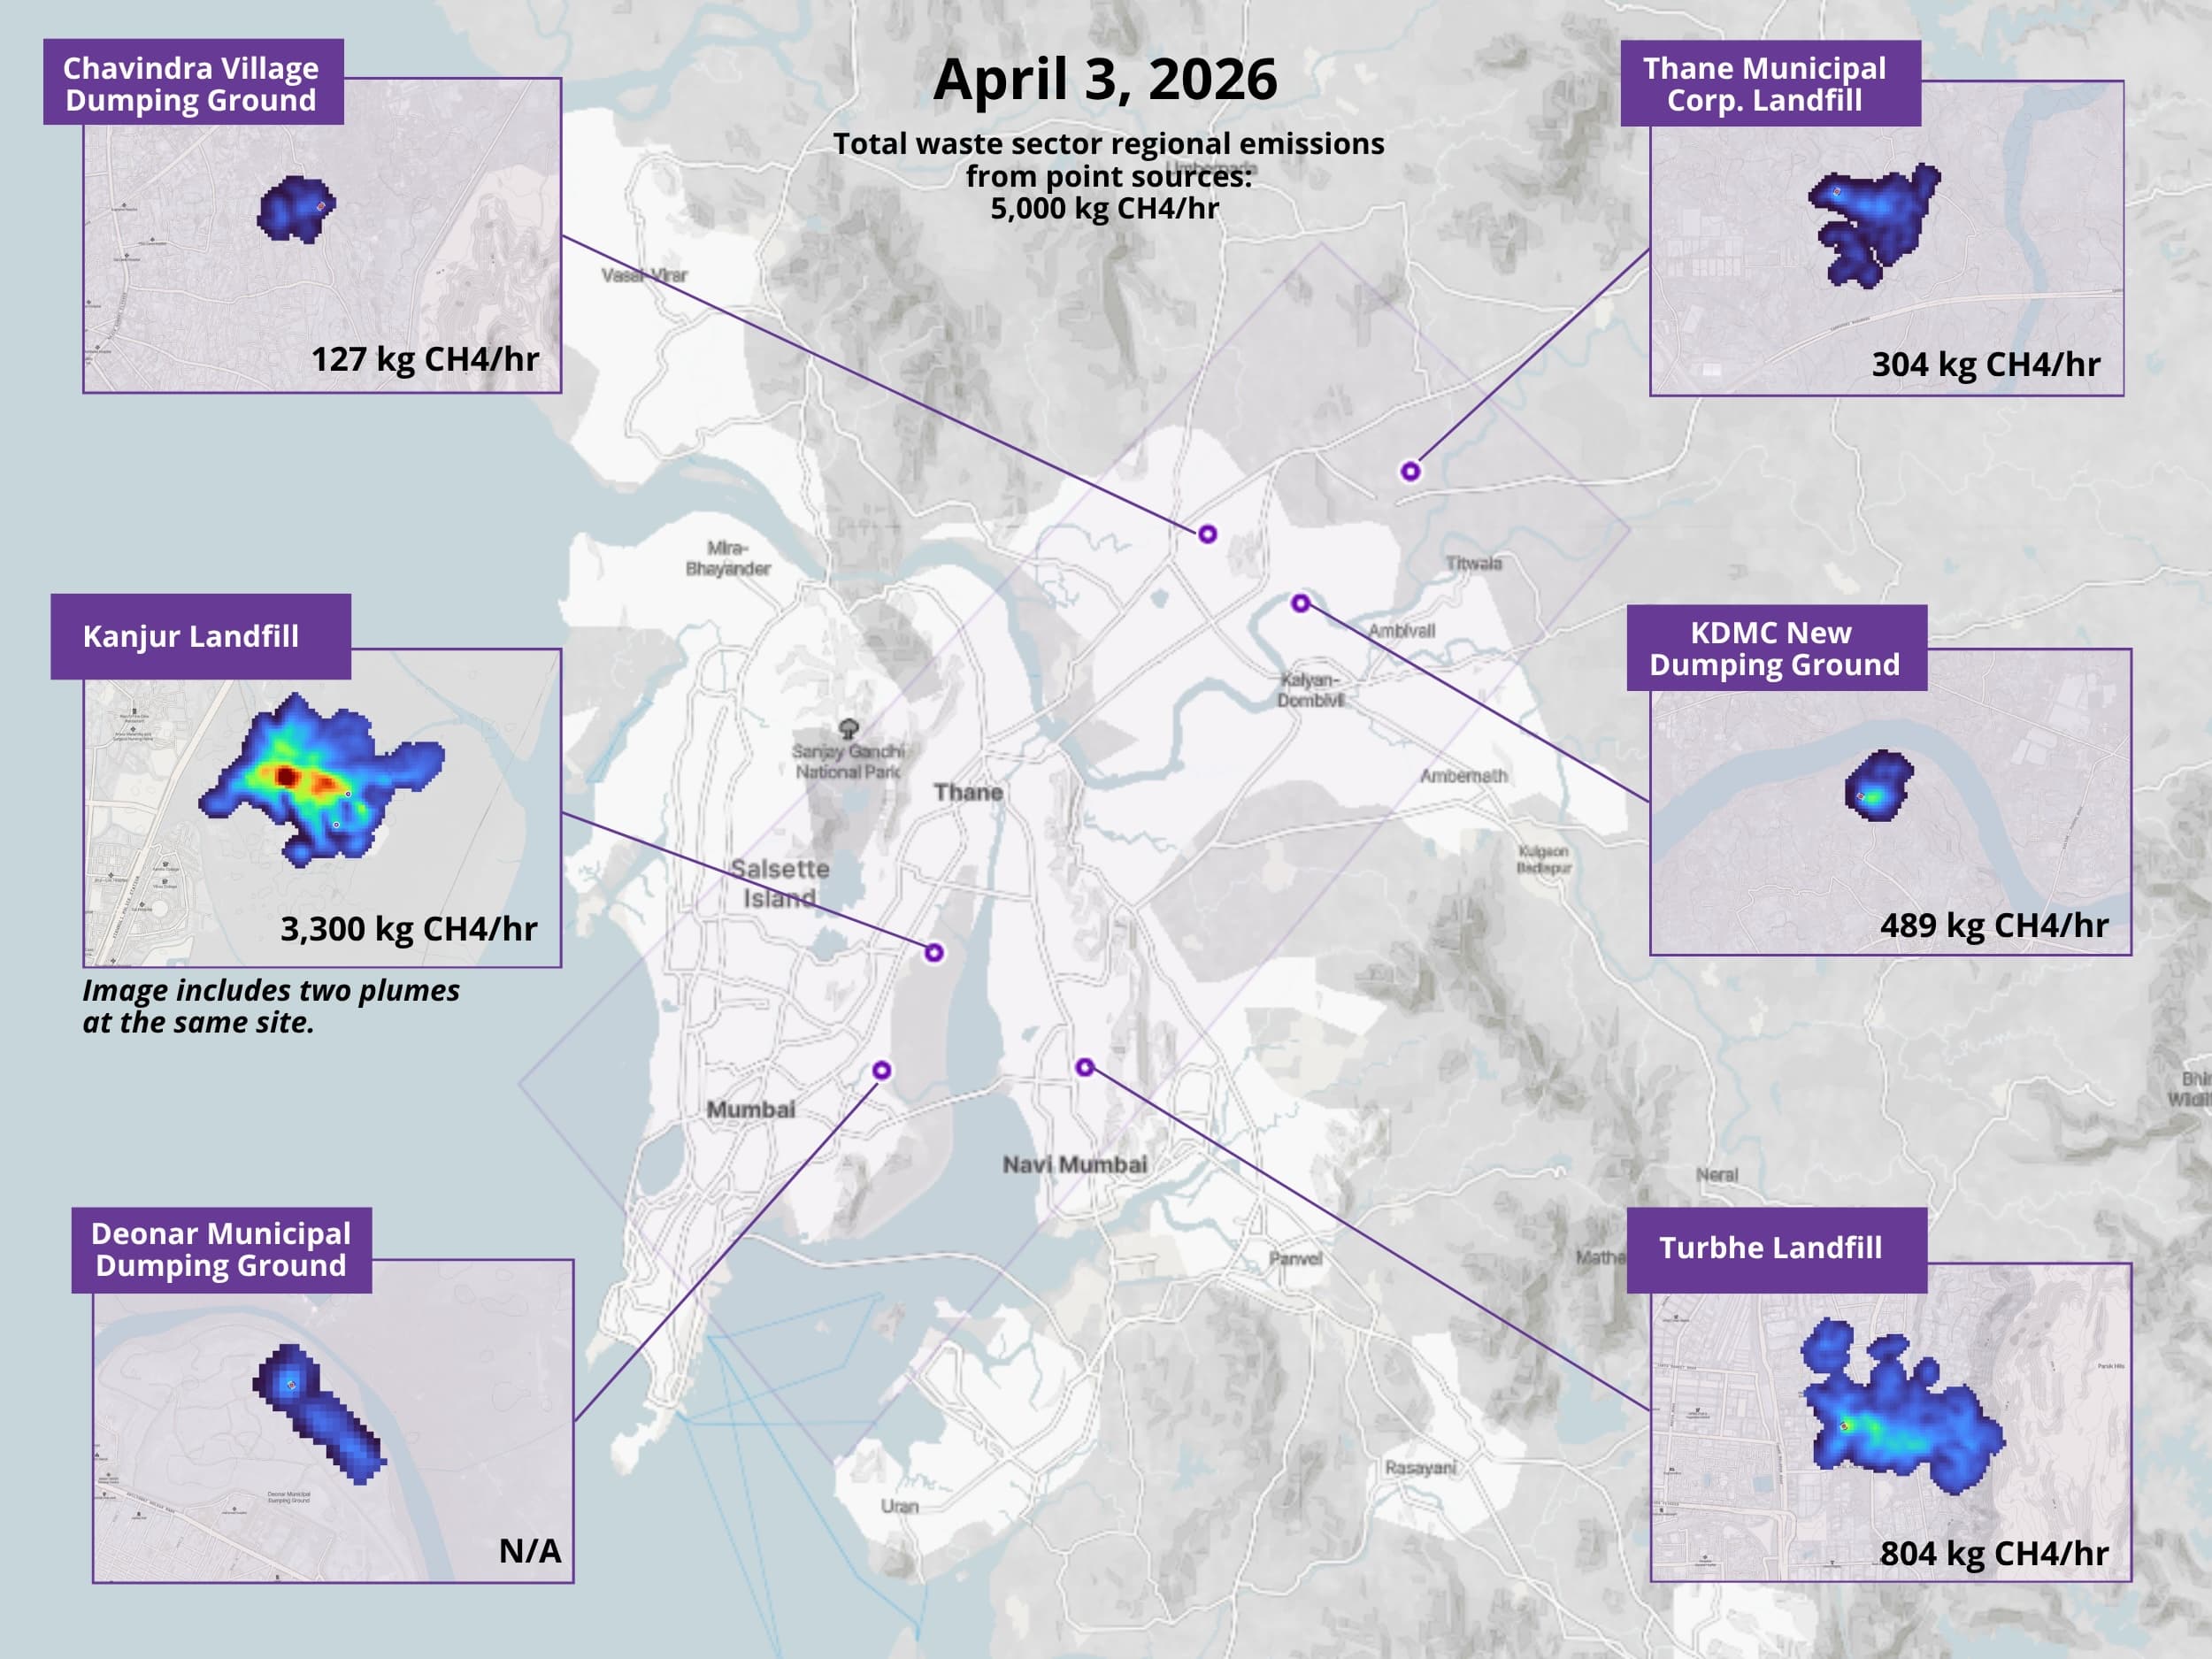
Seven methane plumes from six landfills and dumpsites were observed in a single Tanager-1 scene across the Mumbai region, over one year later, on April 3, 2026.
Looking closer at Mumbai waste sites
Zooming into the Kanjur Landfill, we see in both observations, Tanager-1 detected methane originating from two separate locations within the landfill during a single overpass.
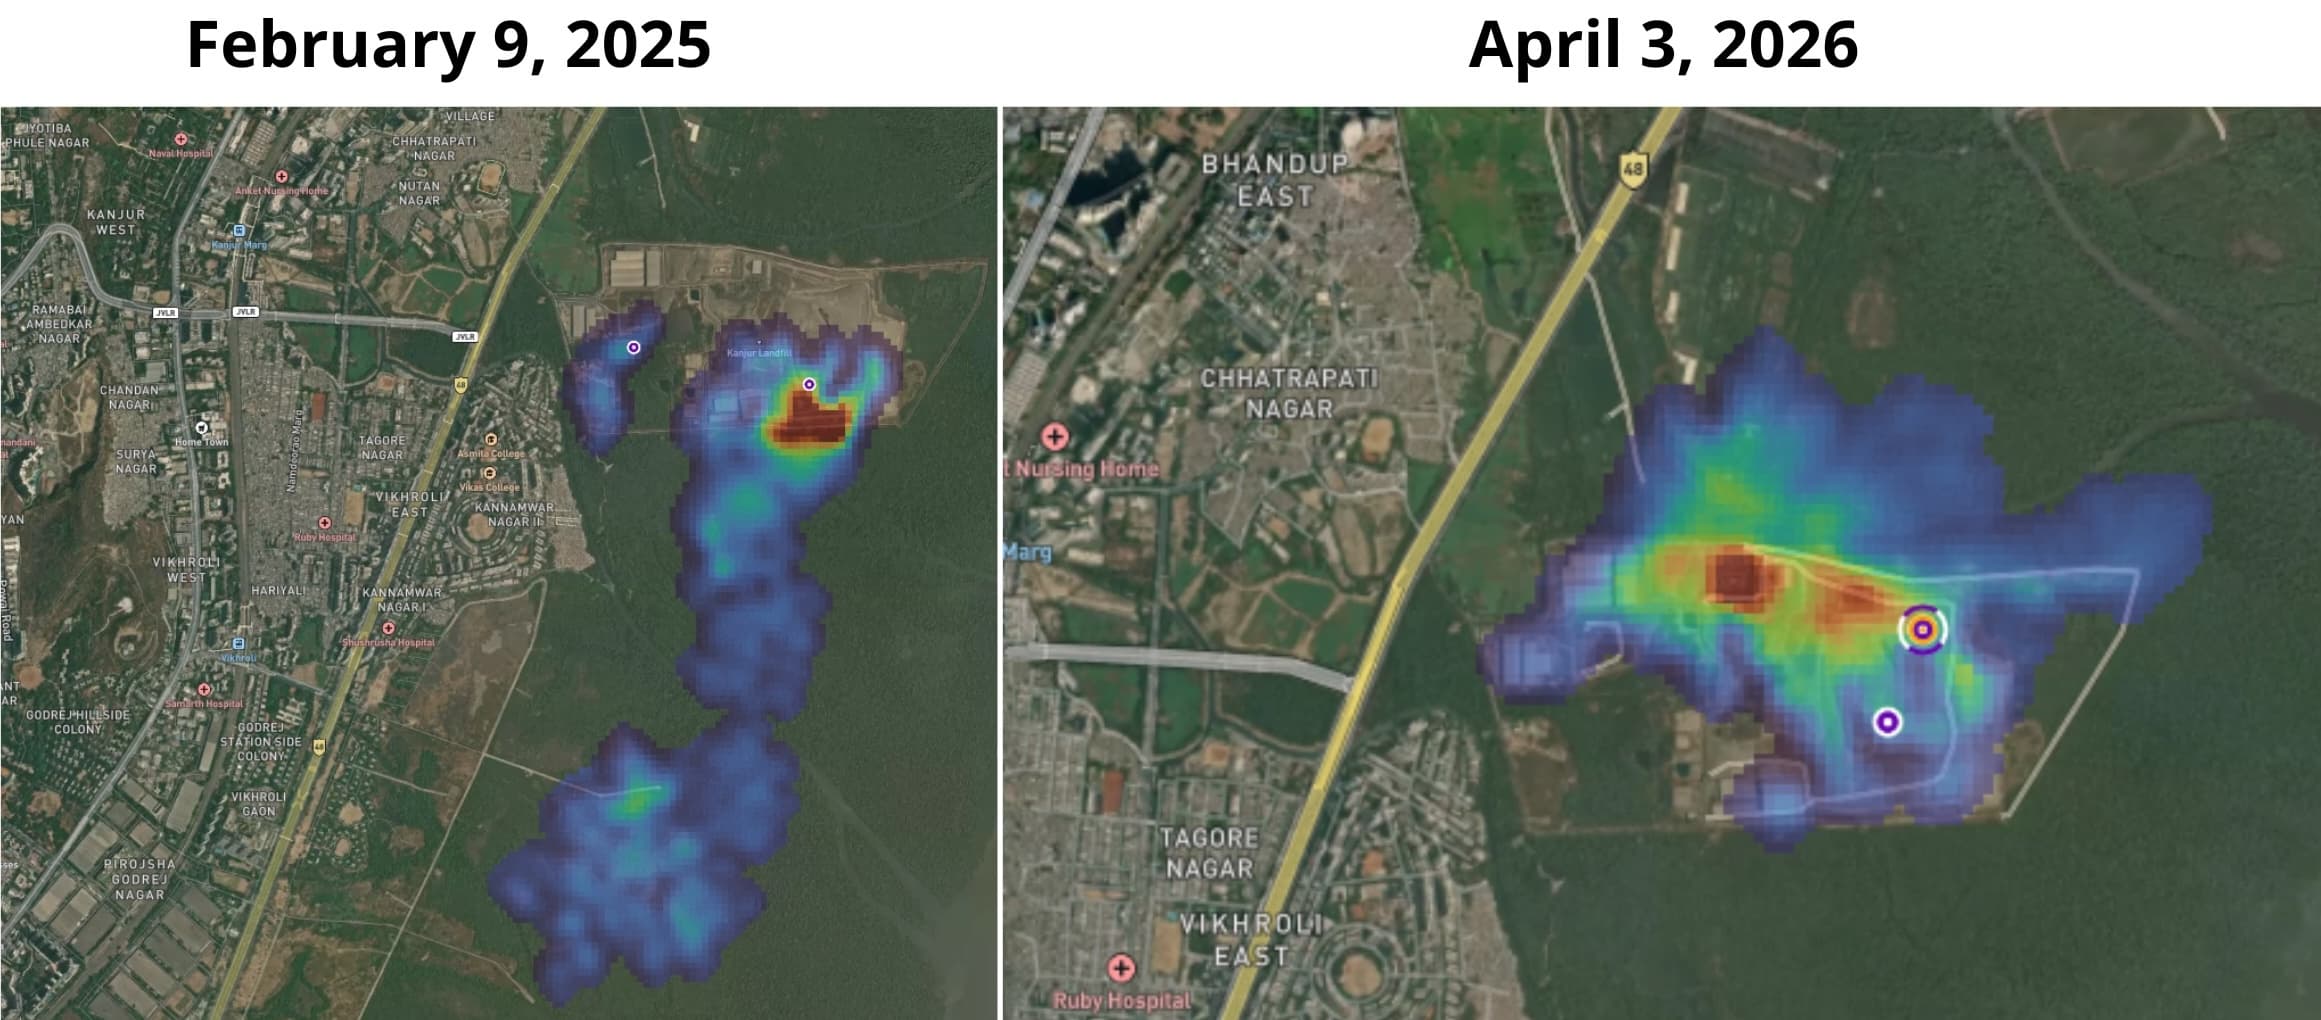
At a landfill in Mumbai, India, Tanager-1 detected methane originating from two separate locations within the landfill during a single overpass.
The left-hand image shows a Feb. 9, 2025 observation of the Kanjur Landfill. Carbon Mapper quantified the plume on the right at approximately 1,600 kg CH4/hr, while the plume on the left was quantified at approximately 136 kg CH4/hr.
The right-hand image shows an April 3, 2026 observation of the Kanjur Landfill. Carbon Mapper quantified the source emission rate as 3,300 kg CH4/hr. This source emission includes two plumes detected at the same site. The plume emission rates were not able to be estimated separately due to their proximity, so a single emission rate was estimated to avoid double counting.
Why this methane data matters
Carbon Mapper data in the region collected over time can help users obtain the big picture — understanding the magnitude of landfill emissions from point sources in the Mumbai region — while also generating site-specific insights.
The big picture on Mumbai waste emissions
Mumbai is the second most populous city in India, with 21.7 million people. It is also one of the densest cities in the world, with approximately 27,000 - 29,000 people per square kilometer. Managing waste in this context brings significant challenges and, as a result, significant methane emissions.
Multiple Tanager-1 satellite observations over Mumbai show a high prevalence of methane super-emitting waste sites in proximity to dense urban areas. This supports findings from past studies, including one from researchers at SRON Netherlands Institute for Space Research and Harvard University which used satellite data from TROPOMI and GHGSat to identify global emissions ‘hot spots’ and narrow down to specific landfills in Mumbai and other regions. Repeated observations of the same facilities across complementary remote sensing technologies helps build confidence that these sites are significant methane sources with persistent emissions. Together, these observations build a clear picture of where large emissions are occurring, and help to identify sites that may warrant investigation and offer the greatest mitigation potential, with a longer-term capability of verifying emissions reductions as mitigation is undertaken.
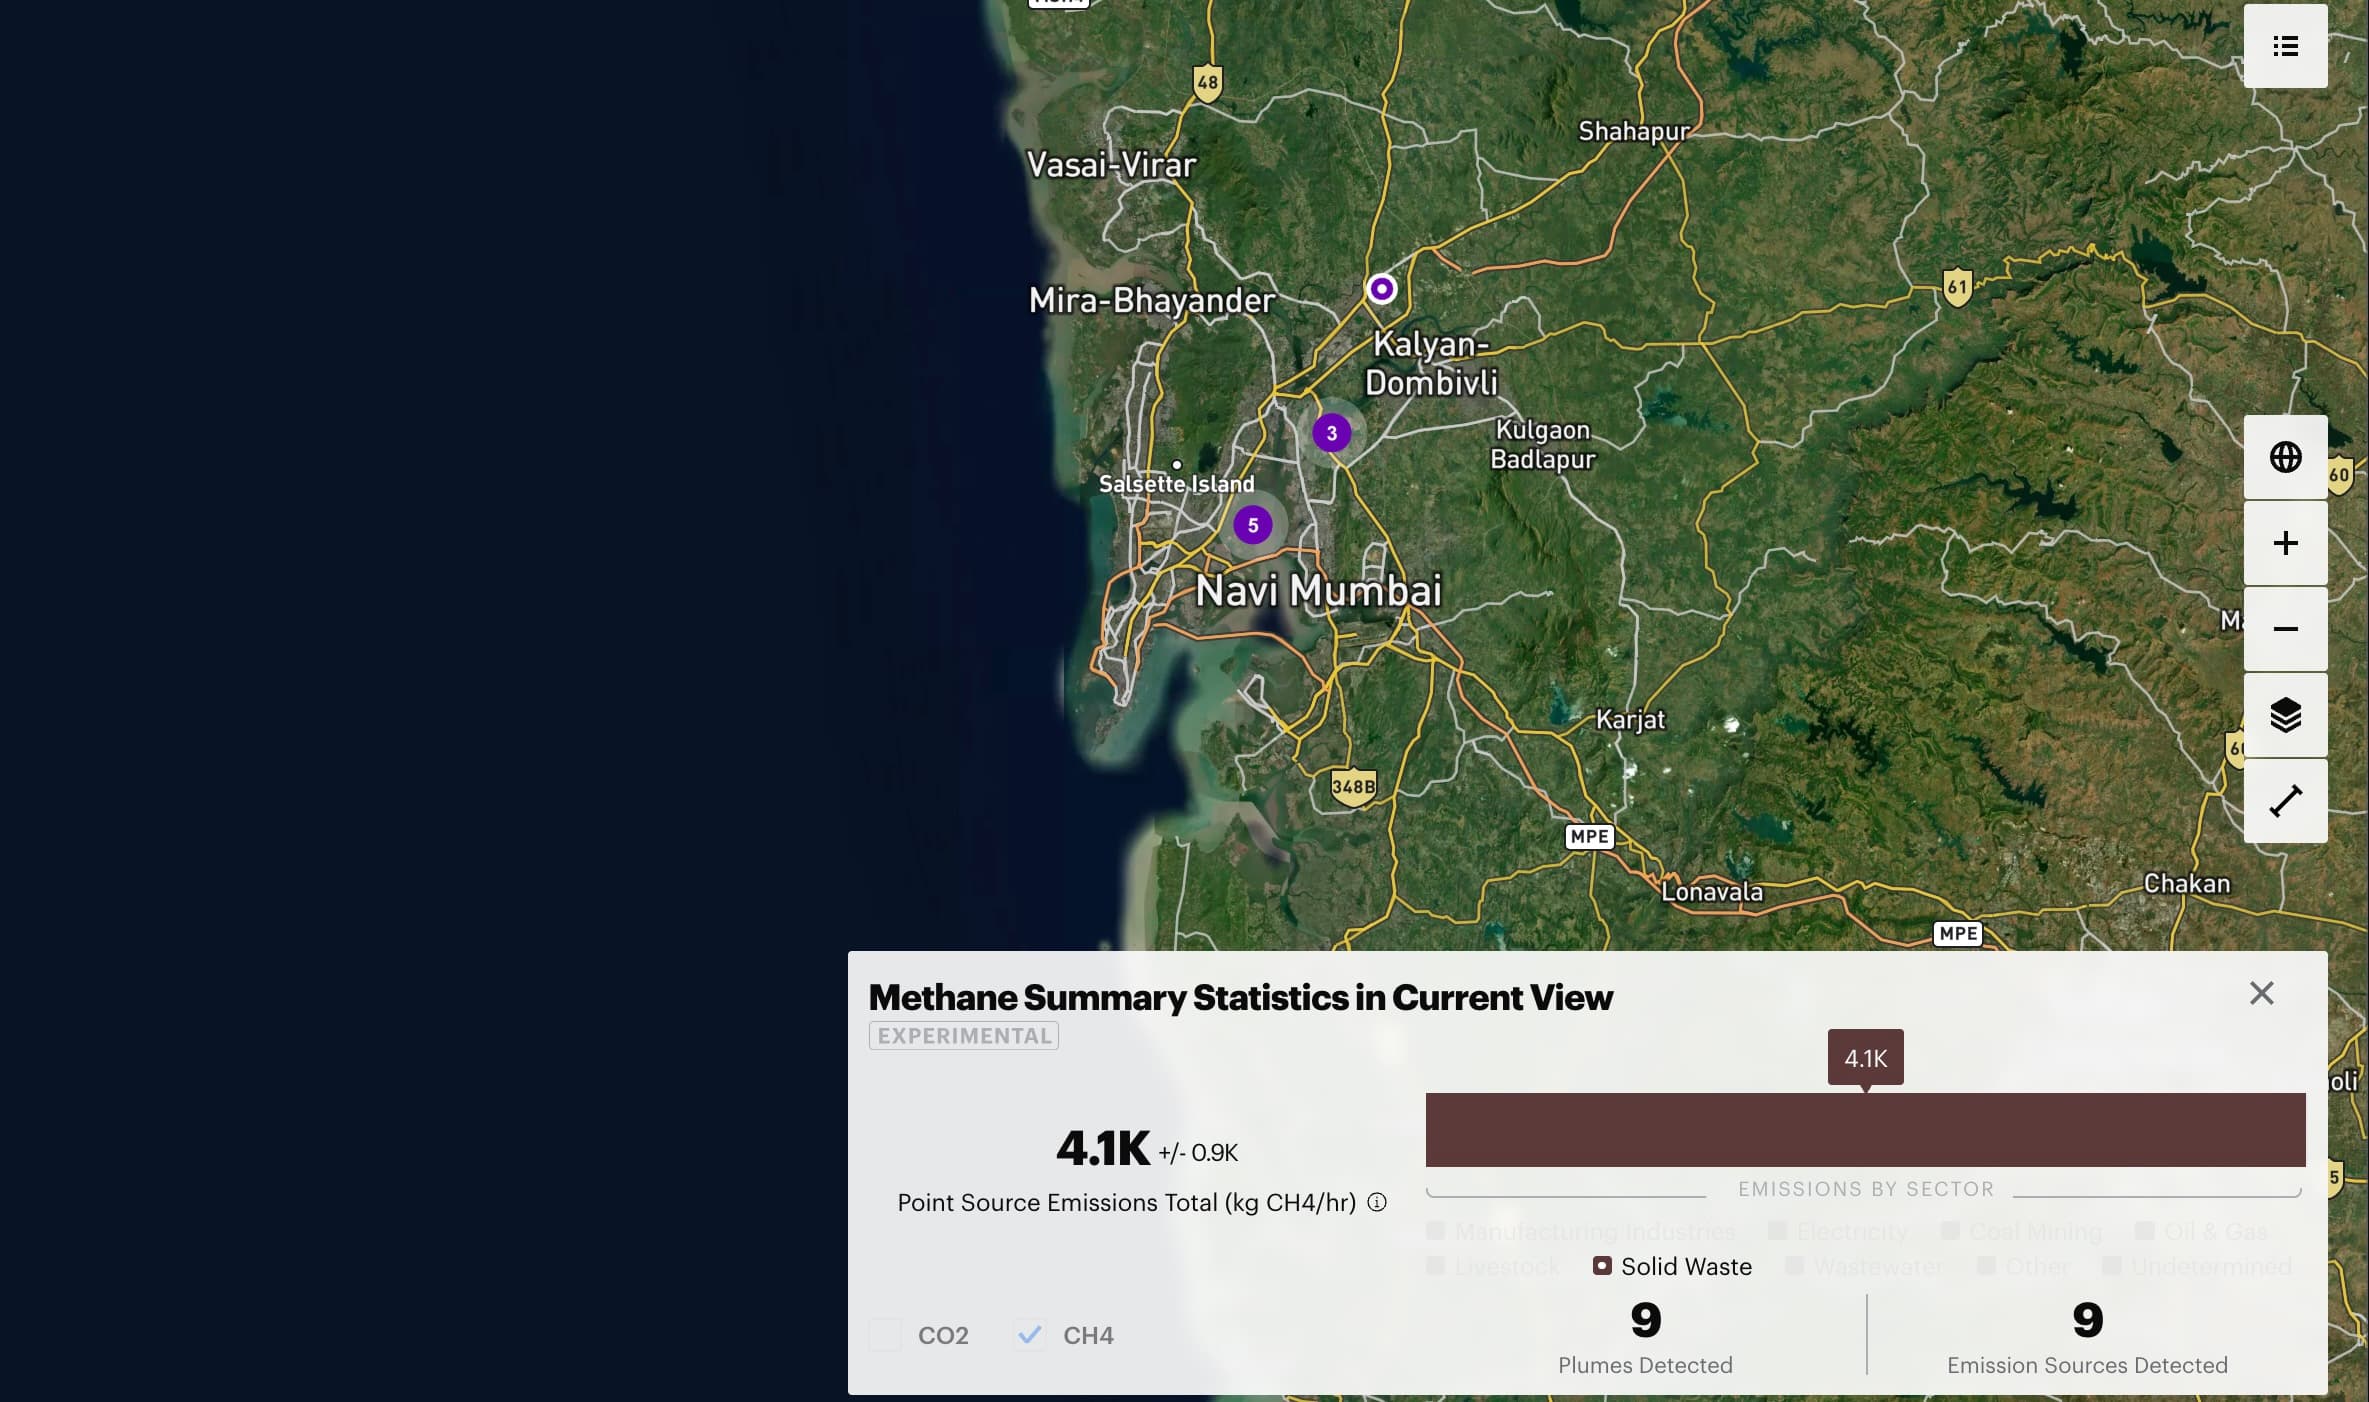
Multiple Tanager-1 satellite observations over Mumbai, India, show a prevalence of methane super-emitting waste sites near dense urban areas.
Site-specific waste emisssions insights
The Kanjur Landfill was recently ranked as #12 on UCLA’s list of the 25 sites in the waste sector with the largest detected and quantified methane emission rates worldwide, as identified by Carbon Mapper with a source emission rate of 4,900 kg CH4/hr.
Following publication of the list, the site received increased public and government attention because of longstanding concerns about odors and air quality in neighboring communities. The Bombay High Court subsequently directed authorities to establish a monitoring committee and implement measures to address persistent odors and methane emissions. After site inspections, the operator implemented odor-control measures and government entities report a decline in odor complaints in the following months — though residents reportedly remain concerned about methane emissions from the site.
Not only has Tanager-1 shown the magnitude of waste sector emissions across the greater Mumbai region, but thanks to the satellite’s high resolution, it can also pinpoint multiple methane plumes within a single landfill. Engineered landfills, like the Kanjur Landfill, can have multiple causes of methane emissions at the same time — as shown by the Feb. 9 and April 3 Tanager-1 observations. Emissions may originate from different operational areas and activities, including the work face (the area where waste is actively being placed), gas collection infrastructure, landfill maintenance, or other parts of the landfill. As a result, it is common for Tanager-1 to detect multiple plume origins in a single observation at these types of sites.
Nearby, the Deonar dumping ground also had persistent emissions across our observations. It has been the subject of long-standing legal battles and calls for closure due to its significant climate, health, and local air quality impacts.
Together, these examples show how satellite observations can help inform public discussion and improve understanding of landfill/dumpsite emissions by (1) identifying significant emission sources and (2) providing transparent information about these emissions, like the locations of high-emitting plumes, to guide mitigation on the ground.
The combination of regional coverage and site-level attribution enables users to identify methane sources ripe for mitigation across an entire region and understand where emissions are occurring within individual facilities. Broad geographic insights combined with detailed site-level spatial information provide researchers, governments, facility operators, and civil society with a more complete understanding of methane emissions from the waste sector.
Explore waste methane data
Visit our data portal to learn more, and try this in your own city of interest.