Product Guide: Data Definition & Specification
Release Date: Oct 07, 2026 — Version: 1.1.7
Introduction
Carbon Mapper is a nonprofit organization developing a global observing system to detect, quantify, and track large methane (CH₄) and carbon dioxide (CO₂) emissions from human activities. Supported by a public-private coalition that includes Planet, NASA’s Jet Propulsion Laboratory (JPL), the California Air Resources Board (CARB), the University of Arizona, Arizona State University, and RMI, Carbon Mapper combines expertise in remote sensing, science, technology, and policy to make emissions data accessible and actionable.
Carbon Mapper uses satellite and airborne imaging spectrometers to monitor emissions from individual facilities and infrastructure across sectors including oil and gas, waste management, coal mining, power generation, and agriculture. These observations help governments, businesses, researchers, and other organizations identify emission sources, assess their magnitude and persistence, and prioritize mitigation efforts.
The Carbon Mapper open data platform processes and publishes emissions data from multiple satellite and airborne instruments. These include Planet’s Tanager satellites, NASA’s Earth Surface Mineral Dust Source Investigation (EMIT) instrument aboard the International Space Station, NASA’s AVIRIS-NG and AVIRIS-3 airborne instruments, and Arizona State University’s Global Airborne Observatory (GAO). Tanager-1 and Tanager-2, launched in August 2024 and October 2026, respectively, represent major milestones toward sustained, global monitoring of methane and CO₂ point-source emissions, with additional satellites planned to expand coverage and observation frequency.
The platform provides information on methane and CO₂ plume locations, concentration enhancements, emission rates, and associated uncertainties, along with source-level information derived from repeated observations. These products support emissions monitoring, scientific research, policy development, and mitigation activities.
Carbon Mapper data products are publicly accessible through our data portal and APIs, subject to applicable terms of use. Data is generally available for non-commercial purposes aligned with Carbon Mapper’s mission of accelerating greenhouse gas emission reductions.
Purpose
This document provides an overview of the products and access mechanisms that make up the Carbon Mapper open data platform. Each product is described below, including its intended uses, release latency, data format, and access methods. All products defined in this document are derived from calibrated, non-orthorectified radiances. More detailed information on the retrieval algorithms underlying these products are provided in Carbon Mapper's Algorithm Theoretical Basis Documents (ATBDs).
Definitions and Acronyms
Definitions
Flux | A mass of methane per unit time, per unit area, independent of sources. |
Emission rate (kg/hr) | A mass of methane per unit time for an individual source, a component of total flux. |
Instantaneous emission estimate | The emission rate calculated for a single plume at a specific moment. This value reflects only that individual observation and does not represent the overall emissions from the source. |
Plume | An excess mass or concentration of gas in the atmosphere emitted from a specific source. Plumes are the atmospheric manifestation of emission processes occurring across various economic sectors. |
Plume Name | A unique identifier for each plume. |
Source | A specific geographic location from which emissions originate. Point sources are a type of source that is associated with a large emission from a concentrated area represented by a specific latitude and longitude. |
Source Name | A unique identifier for each source. |
Plume List | A list of all plumes and associated metadata over a specific time period and region. |
Source List | A list of all sources and associated metadata over a specific time period or region. |
Persistence | The frequency at which a source emits methane or carbon dioxide, defined as the number of plumes detected divided by the total number of unobscured overpasses. |
Null Detect | The absence of detection under optimal observing conditions, such as an unobstructed view of the emission source and a high likelihood of detection. |
Source Emission Rate | The daily average of all emissions attributed to a source, weighted by persistence. Represents the source’s overall emissions, not individual plumes. |
Source Attribution | Attribution of on-the-ground infrastructure to individual plumes. May include information such as:
|
Acronyms
PHME | Potentially Harmful Methane Event: An experimental product defined as a methane emissions event whose resulting surface-level concentrations exceed at least one safety or health-based concentration threshold:
|
IME | Integrated Mass Enhancement: The total kilograms of methane in a plume above the background concentration at the time of the image capture |
MDL | Minimum Detection Limit: The lowest emission rate that a technology can detect given certain environmental conditions (e.g., wind speed, ground reflectivity) that has been validated with ground-truth data |
Sensor Information
Carbon Mapper products are derived from various hyperspectral sensors, also known as imaging spectrometers, deployed on satellites and airplanes. These sensors capture light across a broad range of wavelengths, enabling the detection and quantification of atmospheric gases. By integrating data from multiple sensors, Carbon Mapper can generate and release emissions data for numerous plumes across diverse sources and locations, independent of the specific sensor used. This process, known as data fusion, combines and harmonizes data to provide a more comprehensive view of human-caused greenhouse gas emissions over time. The table below outlines the primary sensors used by Carbon Mapper.
| Provider | Platform | Type | Approximate GSD* | Spectral Bands |
|---|---|---|---|---|
Planet Labs, Inc. | Satellite | 30-43m (varies with look angle) | 400-2500 nm 5nm spacing | |
NASA-JPL | EMIT - Earth Surface Mineral Dust Source Investigation | Satellite | 50-60m | 381–2493 nm ~7.5 nm spacing |
NASA-JPL | AVIRIS-NG - Airborne Visible/Infrared Imaging Spectrometer-Next Gen | Airborne | 3-8m | 380-2510 nm 5nm spacing |
NASA-JPL | AVIRIS-3 - Airborne Visible/Infrared Imaging Spectrometer-3rd Gen | Airborne | 3-8m | 380-2510 nm 7.5nm spacing |
Arizona State University | GAO - Global Airborne Observatory | Airborne | 3-5m | 380-2510 nm 5nm spacing |
*Ground sampling distance (GSD) varies with changes in sensor altitude and off-nadir angle. | ||||
| Detailed Tanager Performance Specifications - Final Operational Orbit | |
|---|---|
Swath width | 18.6 kilometers at nadir |
CH4/CO2 image product pixel size | 30 meters |
Plume geolocation accuracy (CE90) | 50 meters |
Spectral response (FWHM) | 5.5 nm |
Spectral sampling | 5 nm |
Spectral range | 400-2500 nm |
Signal-to-noise @ 2200nm | 310 – 655 (varies with imaging mode) |
CH4 90% Probability of Detection | 90-180 kg/hr* (varies with imaging mode) |
*3 m/s wind, 35 deg Solar Zenith Angle, 25% albedo, 30 m GSD | |
Data Overview
Although methane and carbon dioxide emissions can originate from natural and human-made sources, the Carbon Mapper mission is focused primarily on identifying and monitoring human-made sources. Natural sources of methane include wetlands, rice paddies, wildfires, tundra ecosystems, and the decomposition of organic matter. Human-made sources include oil and gas production, agricultural activities, coal mining, solid waste landfills, and wastewater treatment facilities.
In addition to methane, Carbon Mapper can detect and measure the vast majority of CO2 point source emissions from electricity generation (power plants), cement production, and other industrial processes.
Carbon Mapper organizes its emissions data into two primary data types: plumes and sources.
- Plumes are an excess mass or concentration of gas in the atmosphere emitted from a specific source. They are the atmospheric manifestation of emission processes occurring across economic sectors.
- Sources are specific geographic locations from which emissions originate. Point sources are a type of source that is associated with a large emission from a concentrated area represented by a specific latitude and longitude.
Although plumes and sources correspond to real-world features, their locations in the data may not always align perfectly with actual infrastructure on the ground. These discrepancies can arise due to the varying accuracy of the underlying imagery and the methods used to determine the precise origin of the plumes.
Satellites and airborne sensors can detect plumes by measuring the amount of sunlight absorbed by gas in the atmosphere. By combining wind speed and direction with observed plume mass and capturing multiple observations over time to understand the frequency of emissions better, scientists can accurately estimate the emission rate of sources, not just plumes. A time-series-based aggregation approach like this results in a more complete global environmental impact of super-emitting infrastructure.
Sources and plumes are derived from aircraft or satellite imagery, captured as individual scenes or continuous 'strips.' These geographic boundaries define imaged areas, providing essential spatial references for data analysis and interpretation of Earth observation information.
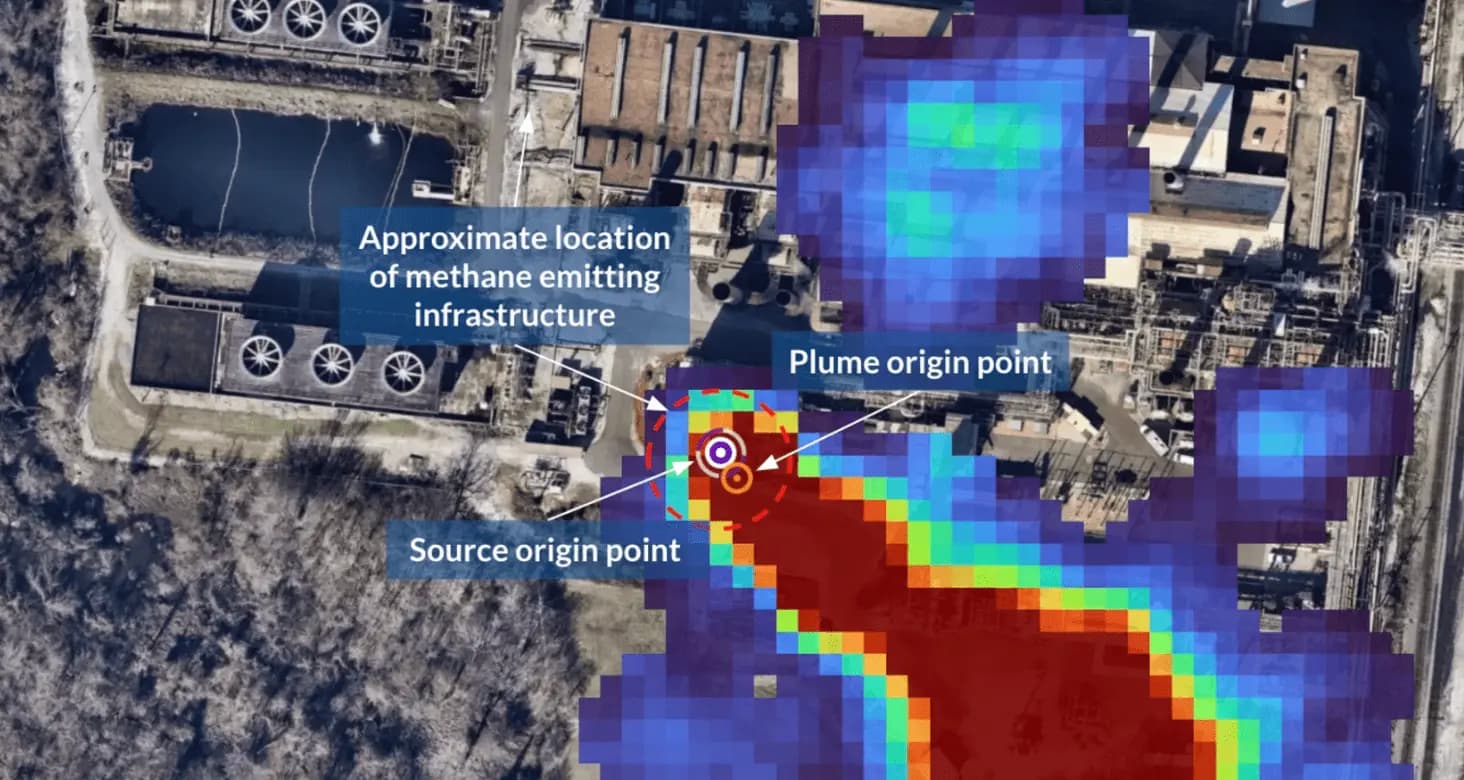
Figure 1: Example of a methane source at an oil and gas refinery and a plume attributed to that source.
Products Overview
Carbon Mapper® products are designed to meet the needs of a wide range of users, from researchers and policymakers to industry and the public. They are organized into five levels, each representing a higher degree of processing, ranging from Level 1 raw radiance data to Level 5 advanced analytics. Carbon Mapper products are publicly available for non-commercial use through the Carbon Mapper data portal and APIs. They provide users with access to data, tools, and documentation to help them explore, analyze, and visualize human-caused point source emissions. Please visit our Terms of Use for information on data licensing.
| Data Product | Description |
|---|---|
Level 1B Calibrated radiance | Calibrated and compressed radiance images, including geolocation and observation geometry information, raster-level masks, and other metadata such as scene and valid pixel outlines, clouds, flares, and specular or dark masks. Generated in sensor and ortho space. Carbon Mapper Internal Product Only |
Level 2A Simultaneous RGB imagery | Orthorectified simultaneous RGB (Red, Green, Blue) imagery derived from radiance by correcting for atmospheric effects and processing to top-of-atmosphere reflectance. |
Level 2B Atmospheric retrievals | Orthorectified whole scene methane and carbon dioxide retrievals derived directly from L1B radiance. |
Level 2C Detections | Orthorectified whole scene salience maps, vector data, or tabular files of candidate plume detections. |
Level 3A Preliminary plume images (quick looks) | Orthorectified preliminary maps of individual atmospheric CH4 and CO2 enhancements (segmented plumes). Otherwise known as “Quick Look” products with
|
Level 3A-PHME | Potentially Harmful Methane Event (PHME) products are methane emission events that produce surface-level methane concentrations that exceed at least one safety or health threshold. L3A-PHMEs are experimental products that are identified and released on a best-effort basis. |
Level 3B Fully processed plumes | Orthorectified final maps of individual atmospheric methane and carbon dioxide enhancements (segmented plumes) that pass quality control checks with
|
Level 4A Plume emissions | CH4 and CO2 plume emissions list including:
|
Level 4B Source emissions | Methane and CO2 source emissions list including:
|
Level 5 Analytics | Analytics include aggregated point source emission rates by sector, time, and geography. Future analytics may consist of cumulative distribution functions, emission variances by sector, fusion, and normalization with non-methane or carbon dioxide datasets (e.g., infrastructure, socioeconomic, etc.), histograms, time series, and regional/sectoral up-scaling. |
Data Access
All Carbon Mapper® data products are publicly available through three channels:
- Carbon Mapper Data Portal: This is a web-based platform where users can view and download Carbon Mapper data products and register for advanced functionality such as API access, saved searches, collection notifications, and more.
- Carbon Mapper Data API: This developer-friendly API provides programmatic access to Carbon Mapper data products through various endpoints such as methane and CO2 plume and source data.
- Carbon Mapper STAC API: This API provides Carbon Mapper data products access using the SpatioTemporal Asset Catalog (STAC) specification. STAC is a standard format for geospatial data that makes it easy to find, access, and use distributed geospatial products.
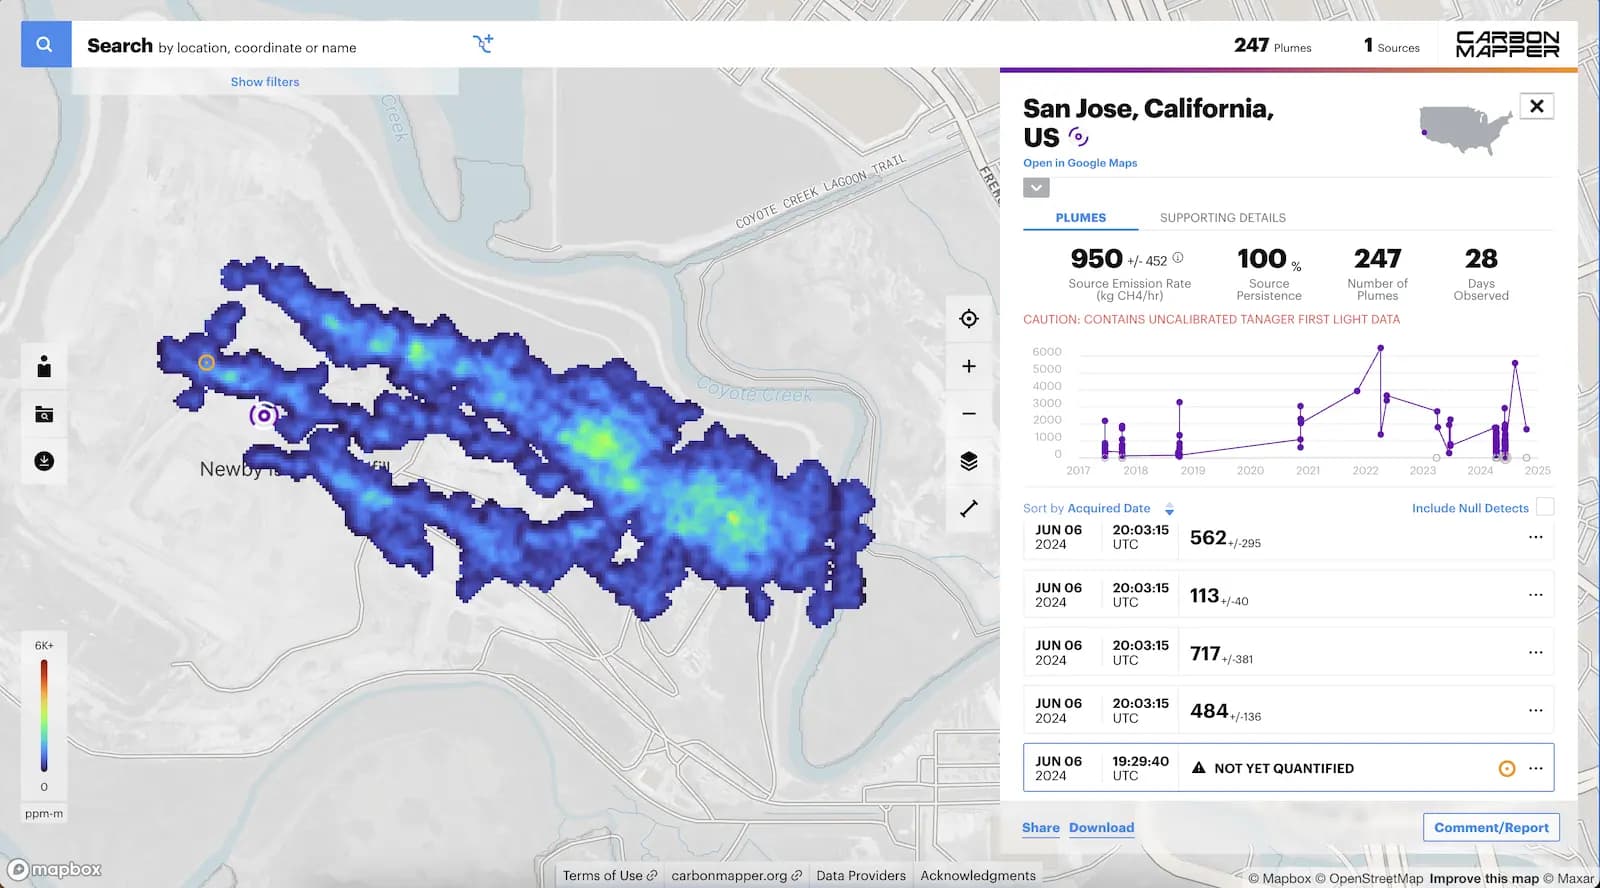
Figure 2: Data portal showing plumes over time at a single source at the Newby Island Landfill, Milpitas, CA
Python
Request:
https://api.carbonmapper.org/api/v1/catalog/plumes/annotated?plume_names=tan20260908t123622c40s4001-A

Response:
{
  "bbox_count": 1,
  "total_count": 1,
  "limit": 10,
  "offset": 0,
  "items": [
    {
      "id": "82884a39-6bda-464b-be95-d6a6eee07406",
      "plume_id": "tan20260908t123622c40s4001-A",
      "gas": "CH4",
      "geometry_json": {
        "bbox": null,
        "type": "Point",
        "coordinates": [-8.08089034674771, 31.9084180309117]
      },
      "scene_id": "4dbc1eaf-b069-47f0-83f0-9125566c48bf",
      "scene_timestamp": "2026-09-08T12:36:22.400Z",
      "instrument": "tan",
      "mission_phase": "production",
      "platform": "Tanager",
      "emission_auto": 1881.9936489076,
      "emission_uncertainty_auto": 352.143071613507,
      "emission_cmf_type": "mfa",
      "gsd": 35.8000091139243,
      "sensitivity_mode": "high_sensitivity",
      "off_nadir": 21.1089156939638,
      "plume_png": "https://catalog.carbonmapper.org/l3a-vis-ch4-mfa-v3e/2026/09/08/tan20260908t123622c40s4001-A/tan20260908t123622c40s4001-A_l3a-vis-ch4-mfa-v3e_plume.png",
      "plume_rgb_png": "https://catalog.carbonmapper.org/l3a-vis-ch4-mfa-v3e/2026/09/08/tan20260908t123622c40s4001-A/tan20260908t123622c40s4001-A_l3a-vis-ch4-mfa-v3e_plume-rgb.png",
      "plume_tif": "https://catalog.carbonmapper.org/l3a-vis-ch4-mfa-v3e/2026/09/08/tan20260908t123622c40s4001-A/tan20260908t123622c40s4001-A_l3a-vis-ch4-mfa-v3e_plume.tif",
      "con_tif": "https://catalog.carbonmapper.org/l3a-ime-ch4-mfa-v3e/2026/09/08/tan20260908t123622c40s4001-A/tan20260908t123622c40s4001-A_l3a-ime-ch4-mfa-v3e_ime-cmf-concentrations.tif",
      "rgb_png": "https://catalog.carbonmapper.org/l3a-vis-ch4-mfa-v3e/2026/09/08/tan20260908t123622c40s4001-A/tan20260908t123622c40s4001-A_l3a-vis-ch4-mfa-v3e_rgb.png",
      "plume_bounds": [-8.1072335079575, 31.8871615736957, -8.07129518522466, 31.9179413437951],
      "plume_quality": null,
      "wind_speed_avg_auto": 3.75,
      "wind_direction_avg_auto": 35.3343121860284,
      "emission_version": "v3e",
      "processing_software": "3.116.0",
      "publication_sources": [],
      "is_offshore": false,
      "collection": "l2c-ch4-v0",
      "cmf_type": "mfa",
      "sector": "6A",
      "status": "published",
      "hide_emission": false,
      "published_at": "2026-10-08T13:19:15.464Z",
      "modified": "2026-10-08T13:19:15.463Z"
    }
  ],
  "nearby_items": []
}
Figure 3: Example request and response from the Carbon Mapper Plumes Annotated endpoint
Level 1 Products
L1B-Calibrated Radiance and Masks
Definition:
Carbon Mapper ingests raw radiance from various providers, calibrates and compresses it in sensor and ortho space, and then utilizes the resulting cloud-optimized data to create a range of derived downstream products. These products include full-strip raster masks and additional metadata, as follows:
- Scene/valid pixel outlines
- Cloud masks
- Flare or artifact masks
- Specular and dark masks
Data Structure:
L1B data products are stored as orthorectified raster images in compressed cloud-optimized formats.
Data Availability:
Carbon Mapper generates L1B products primarily to derive downstream products, which are not released to the general public. Carbon Mapper makes exemplar radiance products available for research purposes, whereas specific radiance products can be directly obtained from their respective data providers.

Figure 4. Rendering of the Tanager-1 satellite, a primary radiance source for Carbon Mapper products.
Level 2 Products
L2-Scene Outlines
Definition:
L2 scene outline products define the geographic boundaries, or 'footprints,' of areas captured by Carbon Mapper satellites and aircraft. These outlines, also called 'strips,' comprise one or more individual scenes. Scene outlines help determine where Carbon Mapper data is collected, the quality of that data, and verify when methane or carbon dioxide sources are imaged, but detection was not observed.
In optimal observing conditions, such as an unobstructed view of the emission source and a high likelihood of detection, the absence of detection is termed a "null detect." In emissions remote sensing, a null detect signifies that an emission detection algorithm has not identified any evidence of methane emissions at a specific location. These null detects imply that the source is not emitting methane above the sensor's minimum detection limit.
Carbon Mapper considers a scene a good candidate for a null-detect status for an emission source if it contains less than 25% cloud cover and intersects any plume origin points associated with the source.
Data Structure:
Vector GIS data including but not limited to the GeoJSON format
Data Availability:
With some exceptions, L2 scene outlines and other Carbon Mapper products are released publicly 30 days after acquisition.
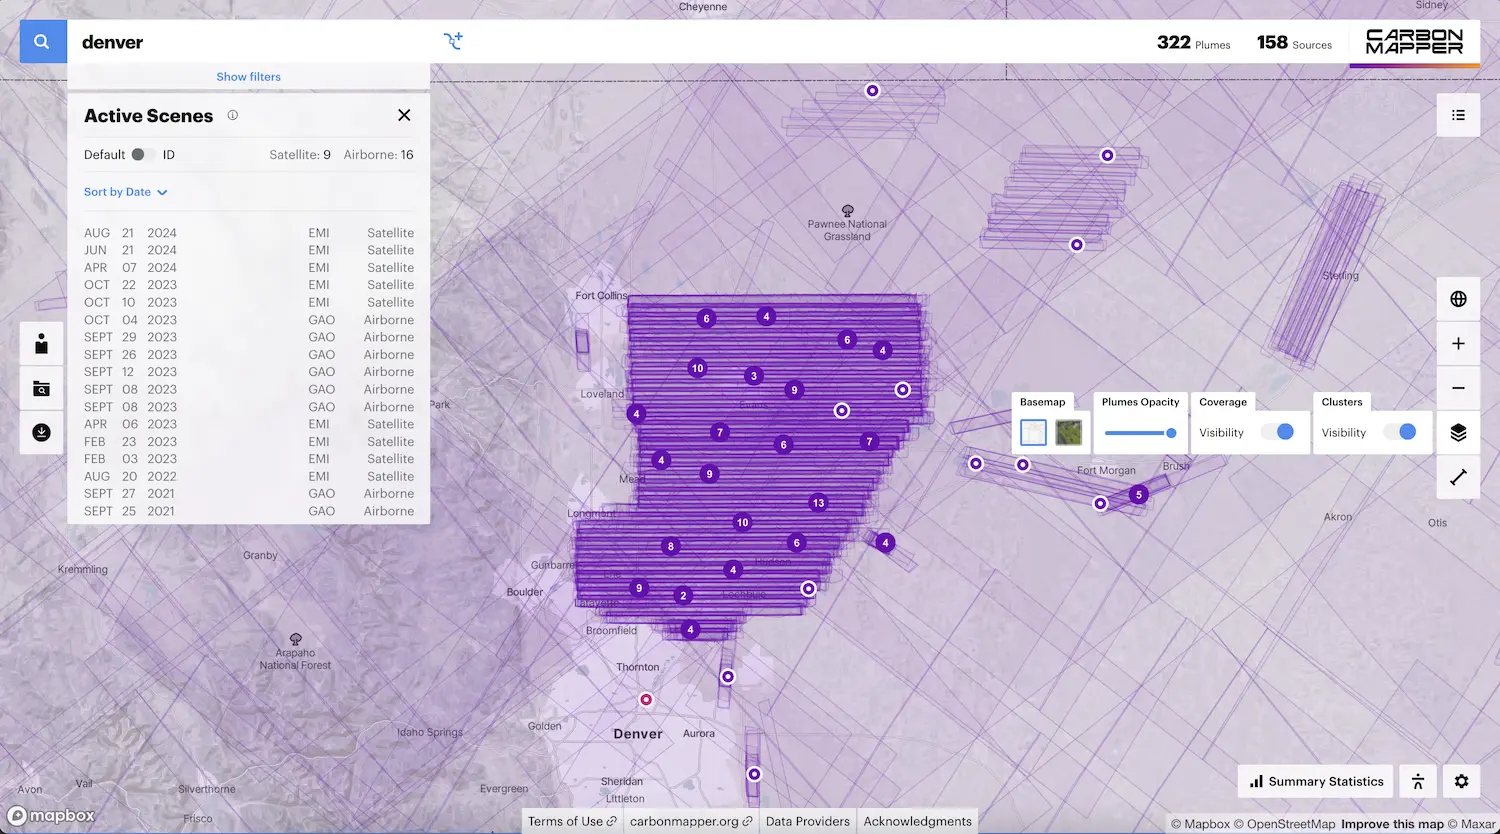
Figure 5. Scene outlines are shown in the Carbon Mapper data portal with a list of active scenes selected for a particular emission source south of Greeley, CO.
L2A-Simultaneous RGB Imagery
Definition:
L2A products are three-band, natural-color images of the Earth's surface generated from raw satellite radiance. This process involves correcting for atmospheric effects, geometric distortions, and terrain variations to produce accurate and visually appealing representations of the Earth. “RGB” stands for the Red, Green, and Blue bands comprising natural-color imagery.
Data Structure:
L2A data products are stored as orthorectified raster images in compressed cloud-optimized formats.
Data Availability:
L2A products are released publicly alongside other Carbon Mapper products 30 days after acquisition.
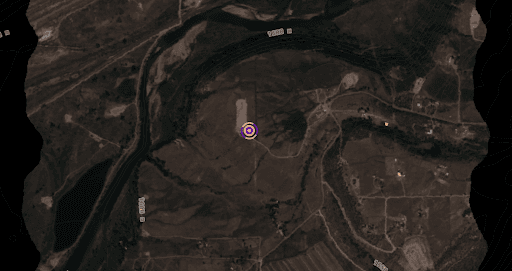
Figure 6. Level 2A simultaneous RGB imagery derived from airborne data underlying a methane source.
L2B-Atmospheric Retrievals
Definition:
L2B products consist of orthorectified full-strip atmospheric retrieval images derived from L1B radiance images. L2B products for methane and carbon dioxide are mixing ratios (i.e., concentrations) estimated for each pixel using a column-wise matched filter algorithm. The matched filter is a fast-running, statistical-based retrieval algorithm validated across multiple airborne controlled releases and aircraft mass-balance surveys.
Different matched filter algorithms are best suited for unique observing environments. Among these, Carbon Mapper has deployed and tested multiple model versions across airborne field campaigns:
- Unimodal (Most validated with airborne controlled releases): Classical column-wise matched filter as described initially.
- ch4mfa: methane (CH4) dynamic absorption spectrum
- co2mfa: carbon dioxide (CO2) dynamic absorption spectrum
- co2mfal: carbon dioxide (CO2) dynamic absorption spectrum, log-normal (used for quantification)
- Multimodal (potentially superior for suppressing systematic artifacts, e.g., flaring): Column-wise matched filter with a clustering of pixels based on radiance values.
- ch4mfm: methane (CH4) multimodal
- ch4mfma: methane (CH4) multimodal, dynamic absorption spectrum
- co2mfma: carbon dioxide (CO2) multimodal, dynamic absorption spectrum
The units for L2B products are typically parts per million per meter (ppm-m). L2B products also include other full-strip images derived directly from L1B radiances; these products may include, but are not limited to, flare retrievals and confuser retrievals that may be used for quality improvements. These products are made from raw L1B data and corrected for geometric distortions so they can be used as the primary input for the plume detection and quality control process.
Data Structure:
L2B data products are stored as orthorectified raster images in compressed cloud-optimized formats.
Data Access:
L2B products are released publicly along with other Carbon Mapper products 30 days after acquisition.
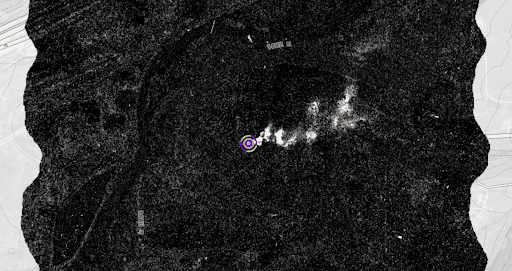
Figure 7. Level 2B methane atmospheric retrieval derived from airborne data underlying a methane source.
L2C-Plume Detections
Definition:
Vector data, tabular files, or orthorectified whole scene salience maps of possible plume origin locations.
Level 2C (L2C) plume detections are generated from L2B atmospheric retrievals by trained analysts using quality assurance and quality control (QA/QC) processes. The analysts leverage whole scene salience maps generated by Convolutional Neural Networks (CNNs) to highlight the essential features in imagery where methane or carbon dioxide emissions are present.
Data Structure:
Tabular and associated raster data (e.g., CSV, GeoTIFF, PNG, GeoJSON)
Data Availability:
L2C products are released publicly along with other Carbon Mapper products 30 days after acquisition.
Level 3 Products
L3A-Preliminary Plume Images
Definition:
L3A products are preliminary methane and carbon dioxide plume images identified by automated or manual processes. They are intended for quick plume size and shape assessment and are unsuitable for final emissions estimates. Each plume includes the following information: acquisition date and time, latitude and longitude of plume origin, initial methane emission estimate, initial emission rate, initial quality flags, and plume length estimate. Carbon Mapper uses L3A products to identify Potentially Harmful Methane Events (PHME) and are only released as part of PHME products.
Latency:
Minimum production latency: ≤ 72 hours from acquisition
Data Structure:
Tabular and associated raster data (e.g., CSV, GeoTIFF, PNG, GeoJSON)
Data Access:
L3A products are not publicly available except in two cases: 1) Potentially Harmful Methane Event (PHME) products, and 2) commercial quick look tasking products from Planet.
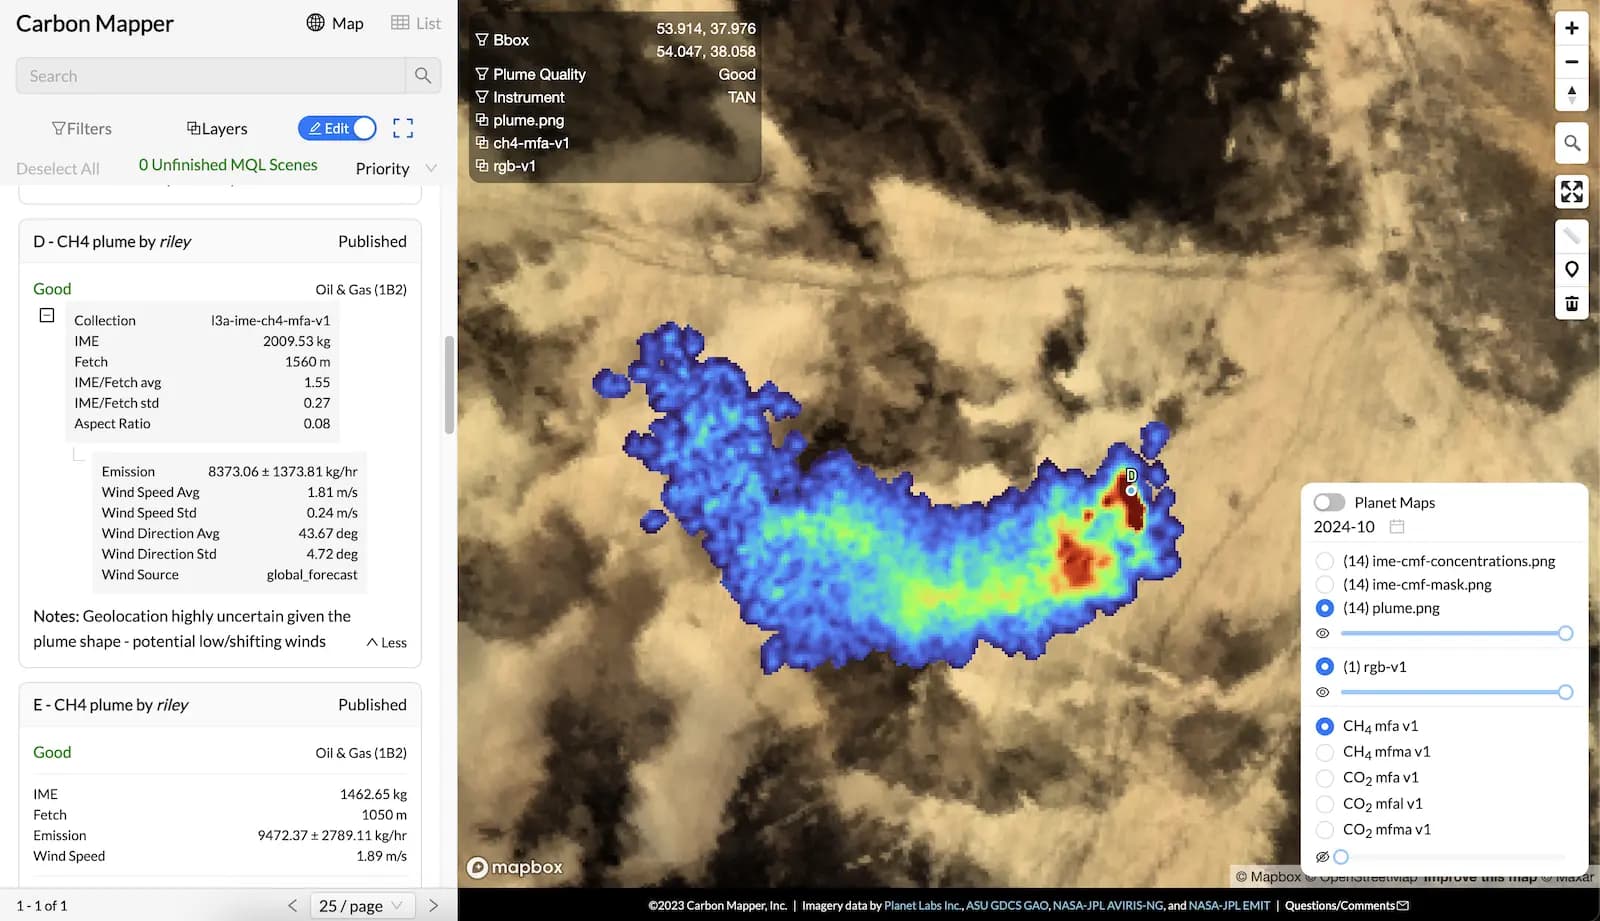
Figure 9. Quality assessment tools for final review of Level 3A methane plume images.
L3A-PHME: Potentially Harmful Methane Event
Definition:
Potentially Harmful Methane Event (PHME) products are methane emission events that produce surface-level methane concentrations that exceed at least one safety or health threshold. L3A-PHMEs are experimental products that will be determined on a best-effort basis. PHME status is activated if plumes meet either of the following criteria. These rules are subject to change and additional consideration by Carbon Mapper analysts:
- Proximity-only: plume origin is within 100 m of the nearest identifiable sensitive receptor (any potentially human-occupied building such as homes, commercial/industrial buildings, schools, hospitals, etc.) which addresses the smallest detectable plumes close to people, OR
- Size and proximity: observed plume length exceeds 1000 meters AND overlaps the nearest identifiable sensitive receptor – which indicates a fairly high emission event and potential for surface mixing ratios exceeding the LEL within proximity to people
PHME products consist of L3A-preliminary plume image products, as defined above.
Latency:
Minimum production latency: ≤ 72 hours from acquisition
Data Structure:
Tabular and associated raster data (e.g., CSV, GeoTIFF, PNG, GeoJSON)
Data Availability:
This is an experimental product. Best efforts will be made to determine PHME status and release associated L3A products within 72 hours after acquisition.
L3B-Fully Processed Plume Images
Definition:
L3B products are georeferenced plume images of segmented atmospheric methane and carbon dioxide enhancements assessed for quality. Each plume image is associated with the following metadata: acquisition date/time, latitude and longitude of plume origin, IME estimate with uncertainty, emission rate with uncertainty, plume length with uncertainty, updated quality flags, and any additional refinement of plume origin. Sector attribution is determined from the following IPCC-defined sector categories.
- Oil & Gas (1B2)
- Solid Waste (6A)
- Waste Water (6B)
- Livestock (4B)
- Coal Mining (1B1a)
- Electricity Generation (1A1)
- Other
When more granular GIS layers are available, additional attribution to the sub-sector, equipment type, or operator level may be possible. When insufficient GIS information exists for source attribution, tasking of current satellite imagery may be initiated.
Quality flags may include but are not limited to
Scene-level quality attributes
- Image artifacts [column, glint, flare, contrast, other]
- Low signal-to-noise [N(default)/Y]
- Atmospheric artifacts [clouds, smoke, haze, other]
- Cloud cover fraction [0, 25, 50, 75, 100] or [0-1]
Plume quality attributes
- Overall rating (Good, Questionable, or Bad)
- plume shape (Y/N)
- artifacts intersect plume (Y/N)
- flare (Y/N)
- high background enhancement (Y/N)
- PHME candidate (Y/N)
Please refer to the Carbon Mapper Quality Control Description Document for a detailed description of the quality flag process.
The L3B product may also undergo alternative retrieval processing using methods such as IMAP-DOAS, Optimal Estimation, etc.). If there is insufficient source data, manual identification, and satellite tasking may require additional time to finalize sector attribution. All data from L3B products are included in all subsequent downstream products.
Data Structure:
Tabular and associated raster data (e.g., CSV, GeoTIFF, PNG, GeoJSON)
Data Access:
L3B products are released publicly along with other Carbon Mapper products 30 days after acquisition.
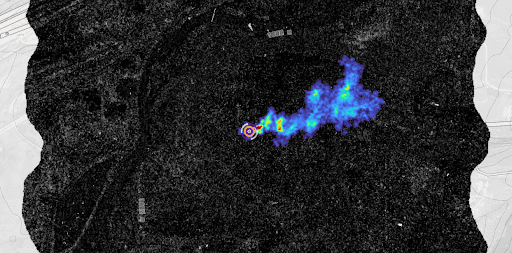
Figure 10. Level 3B final plume image arising from a methane source.
Level 4 Products
L4A-Plume Emissions
Definition:
L4A plume lists are tabular datasets that consist of plume-level instantaneous emissions estimates and uncertainties, wind speed, direction and uncertainties, and all L3B attributes (quality flags, sector attribution, etc.). All L4A products are derived from L3B products and current conditions or reanalysis weather data.
Data Structure:
Tabular and associated raster data (e.g., CSV, GeoTIFF, PNG, GeoJSON)
Data Availability:
L4A products are released publicly along with other Carbon Mapper products 30 days after acquisition.
L4B-Source Emissions
L4B source lists are tabular datasets that consist of an aggregation of plumes mapped to discrete emission sources. Attributes include source identifier, latitude and longitude of source origin and uncertainty, sector attribution, number of overpasses, positive plume detections, persistence estimates, persistence-adjusted average emission rate, and uncertainties. All L4B products are derived from L3B products and current conditions or reanalysis weather data.
Data Structure:
Tabular and associated raster data (e.g., CSV, GeoTIFF, PNG, GeoJSON)
Data Availability:
L4B products are released publicly along with other Carbon Mapper products 30 days after acquisition.
Level 5 Analytics and Data Fusion
L5-Analytics
Definition:
Level 5 products are on-demand or bespoke analytics, including histograms, time series, regional/sectoral upscaling, and fusion and normalization with non-CH4/CO2 datasets (e.g., infrastructure, socioeconomic, etc). An example is the Summary Statistics feature, which provides aggregated point source emission rates for all sources within a field of view or area of interest (AOI).
Data Structure:
Web application analytics, API endpoints
Data Availability:
All analytics are generated dynamically and are not stored permanently.
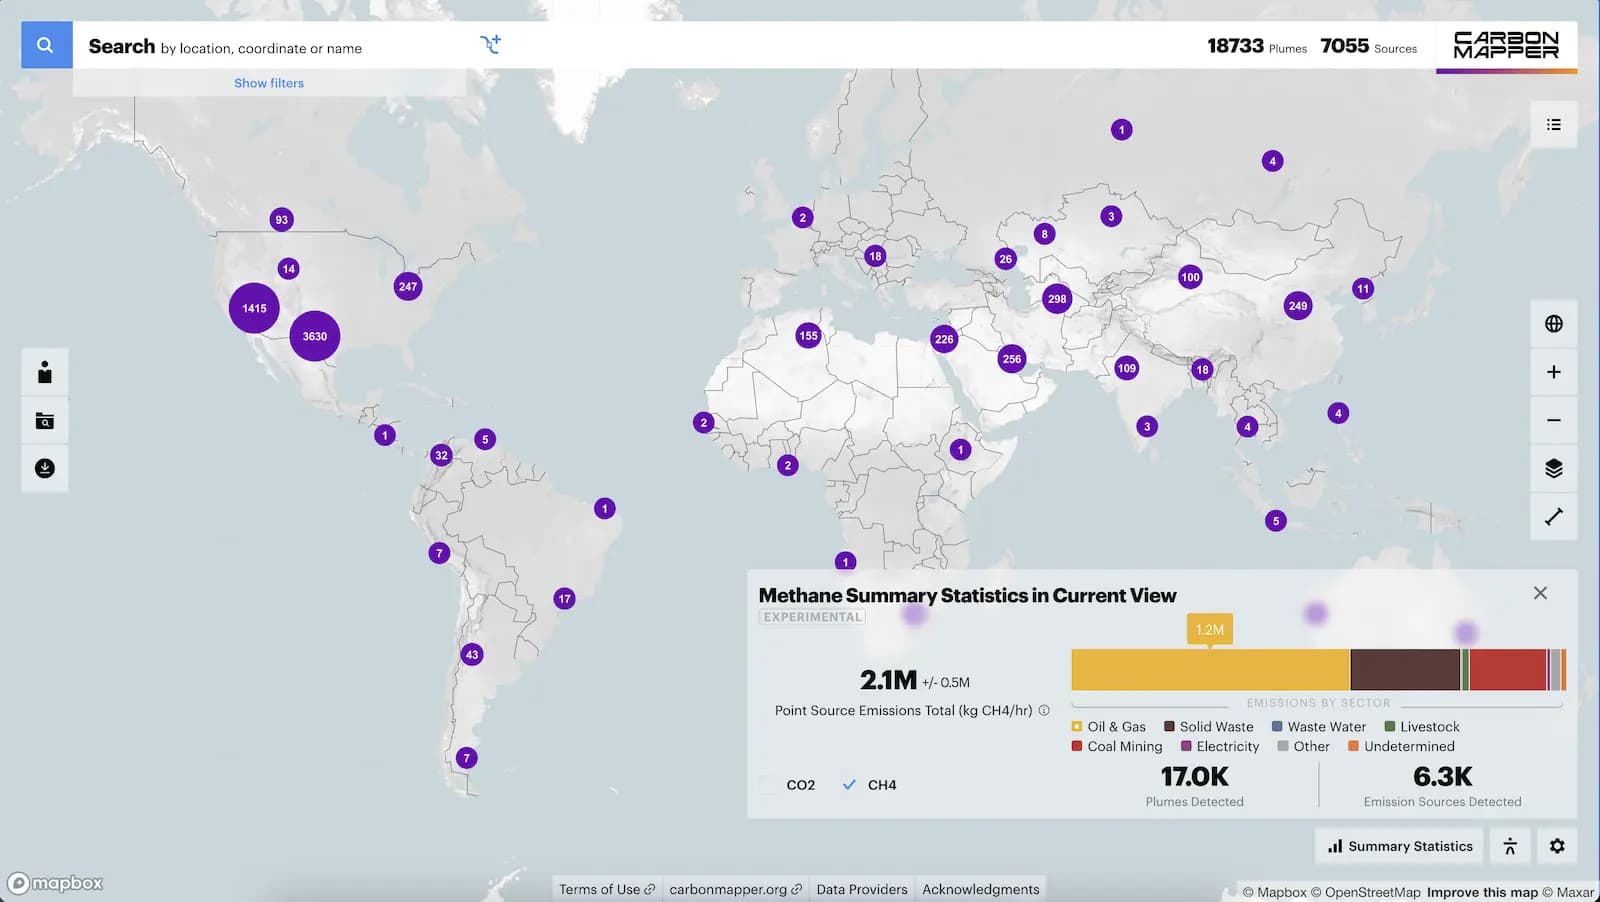
Figure 11. Example L5 analytics include summary Statistics, which summarize total point source emissions across broad geographic areas.
Naming Conventions
Carbon Mapper Level 1, Level 2, and Level 3 data products adhere to the following naming conventions:
Markdown
Planet Tanager L1B:
20190604_193000_00_4902_basic_radiance.h5
L1-L2b item id:
tan20190604t193000c00s4902 (“tan{YYYYMMDD}t{HHMMSS}c{centisecond}s{satellite}")
L2c-L4 item id:
tan20190604t193000c00s4902-A

EMIT L1B:
EMIT_L1B_RAD_001_20230824T175349_2323612_024
L1-L2b item id:
emi20230824t175349p12024
L2c-L4 item id:
emi20230824t175349p12024-A

Airborne Visible/Infrared Imaging Spectrometer-Next Generation (ANG) L1B:
ang20230121t192729_rdn_v2aa3_clip
L1-L2b item id:
ang20230121t192729
L2c-L4 item id:
ang20230121t192729-A

Global Airborne Observatory (GAO) L1B:
GAO20230614t170959p0000_rad
L1-L2b item id:
GAO20230614t170959p0000
L2c-L4 item id:
GAO20230614t170959p0000-A

Plume Item id = {platform}{YYYYMMDD}{HHMMSS}-{part}
Type: Text, unique primary key
A unique plume identifier in the format {platform}{YYYYMMDD}{HHMMSS}-{part}, representing the observing platform, acquisition date and time (UTC), and plume identifier within the image.
Field Names and Definitions
Plume List Fields
| Name | Data Type | Description | Access |
|---|---|---|---|
plume_id | text, unique | Unique identifier for each plume, combining the instrument/platform abbreviation, acquisition date and time, optional scene-specific information, and a plume suffix. Examples include | public |
plume_latitude | decimal degree | Latitude estimate of plume origin. | public |
plume_longitude | decimal degree | Longitude estimate of plume origin. | public |
datetime | UTC timestamp in ISO 8601 format | Date and time of image acquisition in Coordinated Universal Time (UTC). | public |
country | text | Country associated with the plume origin. | public |
region | text | First-level administrative region associated with the plume origin, such as a U.S. state. | public |
place | text | Named place associated with the plume origin, generally a nearby city, town, or locality. | public |
ipcc_sector | text, categorial identifier | Emissions sector associated with the plume, including the IPCC sector code where applicable. Values in this file include Oil & Gas (1B2), Coal Mining (1B1a), Energy Industries (1A1), Manufacturing Industries (1A2), Livestock (4B), Solid Waste (6A), and Other. | public |
gas | text, categorial identifier | Gas detected in the plume. Values in this file are CH4 and CO2. | public |
emission_cmf_type | text, categorial identifier | Statistical-based column-wise atmospheric retrieval algorithm used to threshold methane or carbon dioxide plumes from background concentrations. | public |
plume_bounds | array of 4 decimal degrees, nullable | Geographic bounding box encompassing the plume product, ordered | public |
instrument | text, categorical | Abbreviation identifying the imaging instrument or data source. Values in this file are tan (Tanager), emi (EMIT), av3 (AVIRIS-3), GAO (Global Airborne Observatory), and ang (AVIRIS-NG). | public |
mission_phase | text, categorical | Operational mission phase associated with the observation. Values in this file are | public |
published_at | UTC timestamp in ISO 8601 format, nullable | Date and time the plume observation was published. | public |
modified | UTC timestamp in ISO 8601 format | Date and time the plume record was most recently modified. | public |
ime | float | The total kilograms (kg) of methane in a plume above the background concentration at the time of image capture | available upon request |
emission_version | text | Version of the emissions-processing methodology or algorithm applied to the plume as detailed in the Carbon Mapper Change Log. Values in this file include versions such as | public |
processing_software | text, nullable | Version of the processing software used to generate the plume data, when available. | public |
gsd | numerical, meters, nullable | Ground sample distance: the center-to-center ground spacing of pixels in the source imagery. In this file this field is populated for Tanager observations. | public |
sensitivity_mode | text, categorical, nullable | Instrument sensitivity configuration associated with the observation. Values in this file include | public |
off_nadir | numerical, degrees, nullable | Angle between the instrument line of sight and nadir for the observation. Currently populated for Tanager observations. | public |
emission_auto | numerical, kg/hr, nullable | Estimated plume emission rate generated by the automated quantification workflow. | public |
emission_uncertainty_auto | numerical, ± kg/hr, nullable | Estimated uncertainty associated with | public |
wind_speed_avg_auto | numerical, m/s, nullable | Mean wind speed used in automated plume quantification. | public |
wind_speed_std_auto | numerical, m/s, nullable | Standard deviation of the wind speed used in automated plume quantification. | public |
wind_direction_avg_auto | numerical, degrees, nullable | Mean wind direction associated with the automated plume quantification. | public |
wind_direction_std_auto | numerical, degrees, nullable | Standard deviation of wind direction associated with the automated plume quantification. | public |
wind_source_auto | text, nullable | Wind source from reanalysis (e.g., HRRR, ECMWF_IFS, ERA5) | public |
platform | text, categorical | Platform associated with the observation. Values in this file include | public |
provider | text, categorical | Organization providing the underlying observation/data. Values in this file include Planet Labs Inc., NASA-JPL EMIT, ASU GDCS, NASA-JPL AVIRIS-3, and NASA-JPL AVIRIS-NG. | public |
plume_tif | string (URL), nullable | HTTPS link to the GeoTIFF containing the delineated plume visualization/product. | public |
plume_png | string (URL), nullable | HTTPS link to the PNG containing the delineated plume visualization. | public |
con_tif | string (URL), nullable | HTTPS link to the GeoTIFF containing plume concentration/enhancement values. | public |
rgb_tif | string (URL), nullable | HTTPS link to the natural-color RGB GeoTIFF associated with the plume observation. | public |
rgb_png | string (URL), nullable | HTTPS link to the natural-color RGB PNG associated with the plume observation. | public |
Source List Fields
| Name | Data Type | Description |
|---|---|---|
id | text, unique | Unique identifier for the source. In this file it is identical to |
source_name | text | Source name/identifier. Identical to |
geometry.coordinates | [longitude, latitude] | Estimated source location. Longitude is the first value and latitude is the second. |
bbox | array of 4 decimal degrees | Bounding box associated with the source, ordered |
gas | text, categorical | Gas associated with the source. Values in this file are |
sector | text, categorical | Emissions sector code associated with the source, generally based on IPCC sector classifications. Values in this file include |
plume_count | integer, count | Number of plumes attributed to the source. |
plume_ids | array of text | Array of plume IDs attributed to the source. |
observation_scenes_names | array of text | Array of observation scenes associated with the source, generally formatted as |
emission_auto (source emission rate) | numerical, kg/hr, nullable | Source-level emission rate. Represents the aggregate source emission estimate rather than the emission rate of an individual plume. |
emission_uncertainty_auto | numerical, ± kg/hr, nullable | Uncertainty associated with |
published_at_max | date, nullable | Latest publication date among the plumes associated with the source. |
published_at_min | date, nullable | Earliest publication date among the plumes associated with the source. |
timestamp_max | date | Latest acquisition/detection date among plumes associated with the source. |
timestamp_min | date | Earliest acquisition/detection date among plumes associated with the source. |
detection_date_count | integer, count | Number of unique observation dates on which one or more plumes were detected for the source. |
observation_date_count | integer, count | Number of unique dates on which the source location was observed. |
persistence | numerical, ratio | Frequency of detection, calculated as |
country_iso | text | ISO country code associated with the source. In this file all values are |
basin_id | text/UUID, nullable | Unique identifier for the basin associated with the source, when applicable. |
basin_name | text, nullable | Name of the basin associated with the source, when applicable. |
date_count | integer, count | Detection-date count. Identical to |
Sector Attribution Codes
| Name | Type | Options |
|---|---|---|
Sector (short description) *required | string (single selection) |
|
Sector (database code) *required | string (single selection) |
|
Sub-Sector (not currently in use) | string (single selection) |
|
Equipment Type (not currently in use) | string (single selection) |
|
This product guide is provided for informational purposes only and does not constitute a warranty of any kind. Carbon Mapper disclaims any and all warranties, express or implied, including but not limited to any warranty of merchantability, fitness for a particular purpose, or non-infringement of intellectual property rights. Carbon Mapper, Inc. shall not be liable for any direct, indirect, incidental, special, consequential, or exemplary damages arising from the use of this product guide or the product itself.
Copyright © 2026 Carbon Mapper, Inc., All rights reserved.